


Infographics can be a great way to make boring or obscure data into something beautiful and engaging. But unless you have the design skills to it pull off, you might end up producing a info-disaster. A new free online service called Infogr.am aims to make the creation of beautiful infographics something anyone can do, quickly and easily.
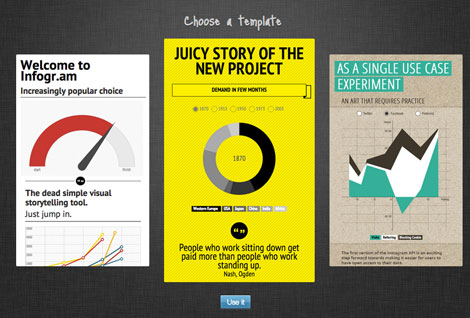
The process of creating an Infogr.am infographic is pretty simple. Start by choosing one of six pre-designed templates.
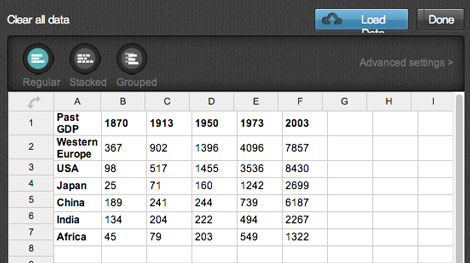
Then add your data by entering it directly or importing an Excel or CSV file.
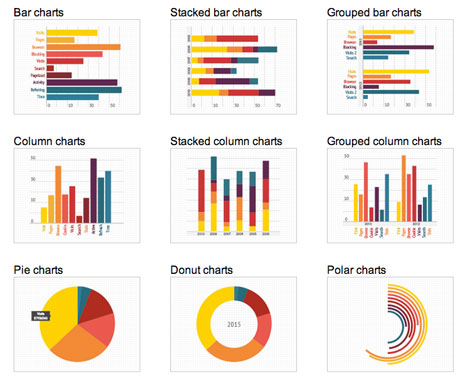
You can customize your infographic by adding charts, maps, text, photos, and videos. There are several kinds of charts and graphs to choose from.

When you’re done, you’re given a URL which is your infographic’s home in the cloud. You can also share it via Facebook, Twitter, or Pinterest, or copy the code to embed your infographic in any web page.
You can also browse and interact with sample charts to get a feel for the way they work.

The service is set up so it’s pretty much impossible to design an ugly infographic because the customization controls are sparse. For example, you can choose a template and customize the colors in your charts, but you can’t change the fonts. So there’s no fear of Papyrus or Comic Sans showing up, but don’t throw away that copy of Illustrator just yet. If you’re looking for a simple way to produce an infographic with interactivity and multimedia, and you don’t have specific design requirements (other than needing it to look good), Infogr.am could be an option worth exploring.
This article was last modified on October 25, 2012
This article was first published on October 25, 2012
Commenting is easier and faster when you're logged in!

Recommended for you

Working with Albums and Collections in Lightroom, Part 2
How to use filters and smart collections in Adobe Lightroom to organize your pho...

Review : Lightroom Mobile
Review: Lightroom Mobile Pros: Automatic synchronization of edits between Lightr...

Photoshop How-To: Making Warhol-style Images
This story is taken from “Adobe Photoshop CS Creative Studio.” The b...