
QuarkXPress How-To: Set the Table in QuarkXPress

In the old days of QuarkXPress, creating tables meant manually breaking long bits with soft returns and multiple tab characters, meticulously aligning tabs, adding rules above and below lines, and manually drawing vertical lines to separate columns of information. The alternative (unless you bought third-party XTensions), at least for Macintosh users, was to use the Subscribe option and link to a Microsoft Excel spreadsheet — which didn’t always output predictably.
In version 5, a new table tool made it a lot easier to set rows and columns of information. In version 6.5, additional controls and options give you even more power over troublesome tables. Here’s how to make the most out of XPress’s table tools, whether your table is simple, somewhat complex, or dripping with data and formatting.
Importing Text into a Table
The most basic way to create a table in Quark is to use the Table tool, which functions just like the Text Box tool: Click and drag to create a rectangular shape that will form the outside dimensions of the table. When you release the mouse button, you can define several parameters:
- The number of rows and columns in the table (you can add or delete rows and columns later)
- Whether the cells will contain text or pictures (this can be changed later for individual cells)
- The tab order of table cells (pressing Control-Tab moves the insertion point from one cell to the next in a table with unlinked cells)
- Whether text cells link to one another (and in what order)
- Whether to link the table to an external data file (discussed more later)
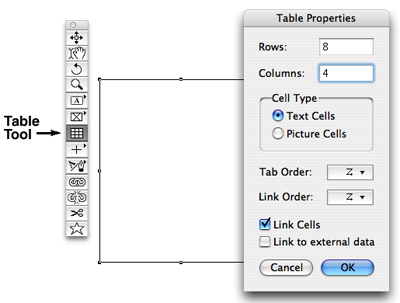
Once you select the Table Tool and click and drag (left), you’ll see the Table Properties dialog box (right).
Click OK in the Table Properties dialog box, and XPress draws your table in the layout.
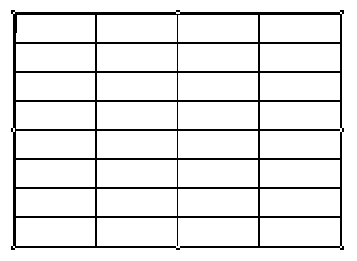
XPress draws the specified rows and columns with equal width and height.
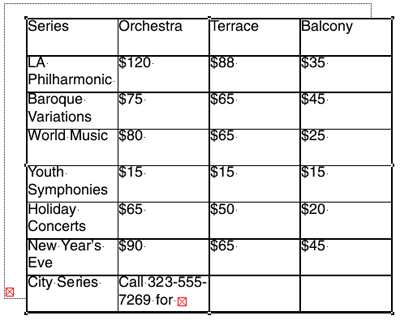
Once you’ve created a table, you can enter or import text into a cell (or series of cells) just as you would into a regular text box. There is, however, a problem with importing text into a table. XPress ignores delimiters (the special characters that separate columns and rows in a text file) such as tabs, commas, or paragraph returns in the imported text.
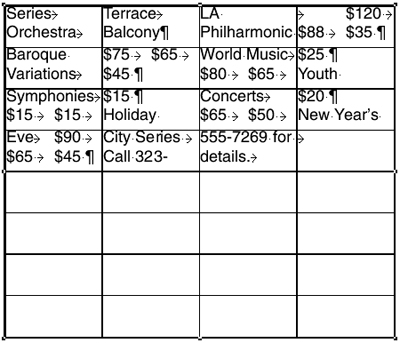
Because XPress ignores delimiters, your text may be an incomprehensible mess after you import it into a table cell.
One way around this problem is to use the Find dialog box to replace all tab and paragraph return characters with the New Text Box characters (/c in the Find dialog box) to move subsequent text along in the text chain. But depending on the complexity of your tables, this can be a tedious and time-consuming workflow.
If this is your situation, try another approach. The Convert Text to Table option may be just the spoonful of sugar you need to sweeten the table-creation process.
Converting Text to a Table
Rather than importing text directly into a table, you can import text into a regular text box, highlight the text, and then choose Item>Convert Text to Table. The Convert Text to Table dialog box defines how the text is imported based on the delimiters (tabs, paragraph returns, and so on) in the selected text. (It’s a good idea to accept the default values when converting text to a table; you can always make any necessary adjustments later, such as deleting extra columns.)
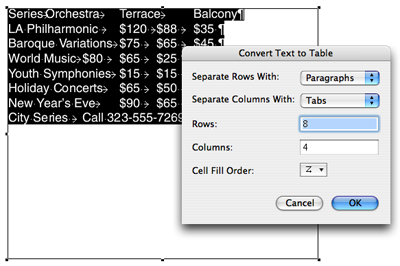
To force XPress to recognize delimiters, use the Convert Text to Table command.
When you click OK in the Convert Text to Table dialog box, XPress places the new table on top of the existing text box. The table has the same height and width as the text box from which the text was converted.
XPress automatically matches the table’s dimensions to those of the text box.
While Convert Table to Text solves some table problems, your text may still need some help. Two of the most common issues are overset text and text inset values. But at least you can format the text, cells, gridlines, and table attributes however you like.
Importing Excel Spreadsheets
Designers often must deal with Microsoft Excel spreadsheets, which can be very complex. In addition to the complexity of the data, your job may be even more complicated if a client has heavily formatted the file.
Thankfully, Quark 6 can link directly (and dynamically) to a spreadsheet, removing several steps and a number of repetitive tasks from the process of including Excel data in a Quark layout.
If you select the Link To External Data check box when you draw a new table, the other options in the Table Properties dialog box are grayed out. When you click OK, you can browse from the Table Link dialog box to find the Excel file with the data you want to include. Once you’ve identified the file, you can also define a specific sheet in the Excel file, and even narrow your link to a specific range of cells within the selected sheet (for example, only import the first five rows and columns, or A1:E5).
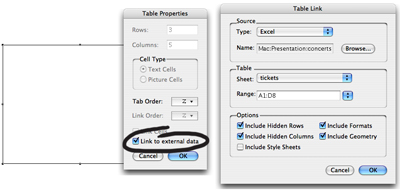
Once you select the Link to external data option and identify the file and sheet to import, you can select particular cell ranges.
The Options area defines how XPress will import the table content into QuarkXPress; the most important choices here are Include Formats and Include Geometry. If you select Include Formats, the XPress table will use the same fonts (if available), cell spacing, and colors as the Excel file. If you don’t select Include Formats, XPress sets the imported table in the default Normal font and doesn’t define cells’ spacing or color.
If you select Include Geometry, the table in Quark will be the same size as the corresponding table in Excel. Otherwise, XPress stretches or shrinks the imported table to fit the size of the table that you drew with the Table tool.
The imported Excel table might not be perfect; for example, column width doesn’t always translate accurately. But it is the easiest way to recreate a complicated table in XPress.
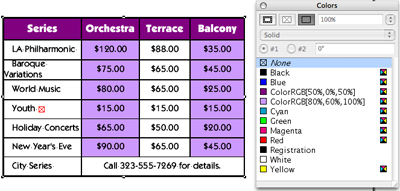
To clean up this imported Excel table, extend the width of the first column to correct the bad alignment and overset text.
Caveat: When you import a table and include the Excel formatting, XPress imports the colors applied in the Excel file into the XPress layout and the Colors palette. The Excel colors are RGB, so you’ll have to convert them to the nearest possible CMYK equivalent before sending the file to output.
Updating Linked Tables
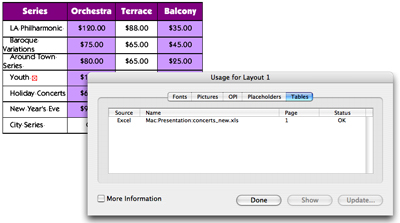
When you link to an Excel table, the link is dynamic, just as a link to a picture file is dynamic. The Usage dialog box includes a Tables tab that lists the status of all tables linked to the layout. If someone has opened and modified an Excel file since you linked to it, the Status column shows that the table has been modified. You update the table as you would update a modified image file: simply click the Update button, and XPress changes the information for you.
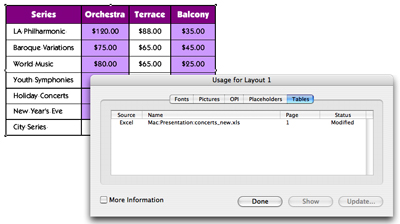
The Usage dialog box alerts you when the linked Excel file is changed after you import it into XPress.
While the advantage of automatic updating is obvious, the drawback is that updating a modified table overwrites any text or formatting changes you applied in the XPress layout. If you’ve applied extensive formatting, you will have to repeat your work when the table is updated.
Here you can see that updating the modified table changes the first-column width back to the original imported width. You have to re-adjust the column to correct the line breaks and overset text icon.
When someone modifies an Excel file since you imported it into Quark, you will get a warning message when you try to print. You can update the table, but it’s not necessary; unlike images, modified tables don’t cause printing problems. The version of the table that exists in your layout is the version that will print when you output the file.
Tips for Working with Tables
- You can convert the content type of selected cells by choosing Item>Content. Tables can have any combination of Text, Picture, and “None” cells.
- Use the Linking and Unlinking tools to direct or redirect the flow of text through a table, just as you would link or unlink individual text boxes.
- Convert a table back to tab-delimited text by choosing Item>Table>Convert Table To Text.
- You can also convert a table to a group of individual boxes by choosing Item>Table>Convert To Group. Each cell in the table becomes a discrete text box.
- If you convert a table that’s linked to external data to text or a group, the converted objects are no longer linked to the external data file.
- Select entire rows or columns by clicking just outside (above to select a column or to the left to select a row) the table.
- To select nonadjacent table cells, press the Shift key and click each cell you want to select.
- In tables, press the Tab key to move the insertion point to the next tab stop. Press Control-Tab to move the insertion point from one cell to the next.
- The Item tool always selects the entire table. You must use the Content tool to work with individual cells or the content of cells.
Polishing the Silver, and a Little Bit of Tarnish
The different options for building tables each have advantages and disadvantages. If you’re building a table from scratch, you can use the Table tool and formatting options and design away. If you’re bringing data in from a database, converting tabbed text to a table is a good starting point. If you’re bringing in data from an Excel spreadsheet, linking directly to that file is usually the best place to begin.
No software application is perfect, and Quark is no exception. The key to being a power user is not only knowing what works, but also knowing what doesn’t work — and knowing how to get around the limitations. Working with Quark tables is not without its problems, but the available options are a welcome addition and will hopefully be improved in future versions of the software.
This article was last modified on January 10, 2022
This article was first published on May 17, 2005
Commenting is easier and faster when you're logged in!

Recommended for you
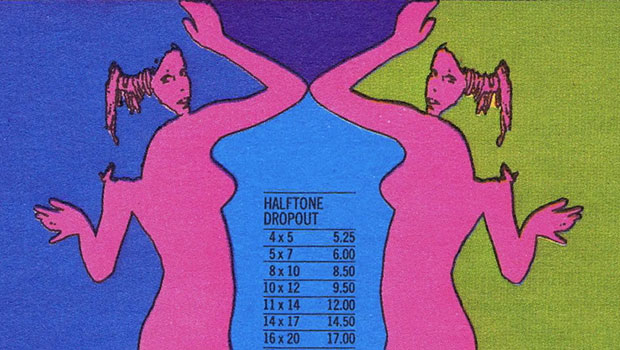
Scanning Around With Gene: Groovy Graphic Design from 1967
Strolling through the aisles of a giant used-book sale for the Marin Public Libr...

TypeTalk: To Everything, Kern, Kern Kern…
Q. What does the word “kerning” mean? A. The term kern originated as...

Before&After: Design a Flier That Sells
The key to an advertisement that sells is simple: Keep all eyes on the product.